Viscous Flow vs Molecular Flow — Why Gas Behaviour Changes
Estimated time: 20–25 minutes
Differentiate viscous flow from molecular flow; describe how mean free path determines the flow regime; explain the practical consequences for pump-down. Competency: M03-COMP-01, Indicators M03-IND-01.02, M03-IND-01.03
Orient
In Module 1, you learned that gas molecules collide frequently at high pressure (viscous flow) and bounce off walls at low pressure (molecular flow). That was an introduction. Now you'll understand why this matters so much for vacuum system performance.
The flow regime determines everything: how fast gas moves through tubes, how effective the pump connection is, and why pump-down curves have the shape they do.
Core Content: Mean Free Path — The Key Concept
Mean free path is the average distance a gas molecule travels between collisions with other molecules. It's the single concept that explains the viscous-to-molecular transition.
At atmospheric pressure (~950 mbar): Mean free path ≈ 0.07 micrometres. Molecules are packed tightly and collide constantly — like walking through a dense crowd. They can't travel far without hitting another molecule.
The gas behaves like a fluid — gas molecules pushing together as one mass, like water flowing through a pipe — and flow is driven by pressure gradients pushing that fluid along. This is viscous flow.
At 1 mbar: Mean free path ≈ 70 micrometres. Molecules have more room.
Collisions are less frequent. The gas is beginning to transition.
At 0.01 mbar: Mean free path ≈ 7 millimetres. Molecules can travel millimetres between collisions — comparable to the diameter of small tubes and fittings.
At 10-3 mbar: Mean free path ≈ 70 mm. In a tube of 25 mm diameter, molecules are far more likely to hit the wall than another molecule. This is molecular flow — individual molecules bounce randomly off surfaces, like pinballs ricocheting off bumpers instead of flowing like water, with no collective fluid-like behaviour.
The transition occurs when the mean free path approaches the characteristic dimension of the system (usually the tube diameter). This is the transition flow regime — the in-between state where gas behaviour is shifting from collective movement to individual bouncing, like a crowd of people gradually thinning out until everyone is walking their own path instead of moving with the group. Neither viscous nor molecular models apply cleanly in this zone.
Why This Matters for Pump-Down
In viscous flow (high pressure):
- Gas moves as a fluid — pressure pushes it through the system
- Pumping is efficient — the pump "grabs" a plug of gas and removes it
- Conductance through tubes is high — the gas flows easily
- Pump-down is fast
In molecular flow (low pressure):
- Gas molecules move independently — no collective flow
- Molecules must randomly drift into the pump inlet to be removed
- Conductance through tubes drops dramatically — molecules bounce off walls randomly and many bounce back toward the chamber
- Pump-down is slow
This is why every pump-down curve has the same characteristic shape: fast drop initially (viscous flow), gradual slowdown (transition), then very slow progress at low pressure (molecular flow). It's not the pump failing — it's physics changing the rules.
You can now explain how mean free path determines the flow regime and why pump-down slows at lower pressures. The table below puts numbers to these transitions so you can connect flow regime changes to specific pressure ranges on R1-A.
Basic Vacuum Practice — Varian
Basic Vacuum Practice, Ch. 1, p. 27: Conductance bottleneck — chamber connected to pump via pipe showing 400 L/sec pump delivering 75 L/sec at chamber.
This page illustrates the conductance bottleneck concept with a clear example — a 400 L/sec pump delivering only 75 L/sec at the chamber due to pipe restrictions. This single diagram captures why effective pumping speed is always less than the pump's rated speed.
The Pump-Down Curve Explained
On R1-A, a typical pump-down from ~950 mbar looks like this:
| Phase | Pressure Range | Flow Regime | What You Observe on R1-G-CH |
|---|---|---|---|
| Phase 1: Fast drop | 950 → ~10 mbar | Viscous | Rapid, steady decline. Gauge drops visibly every few seconds. |
| Phase 2: Transition | ~10 → ~0.1 mbar | Transition | Decline slows. Each order of magnitude takes longer than the last. |
| Phase 3: Slow approach | ~0.1 → base pressure | Molecular | Very slow decline. Minutes per small pressure drop. Gas load from surfaces (M02) dominates. |
The transition pressures are approximate and depend on the system geometry (tube diameters). But the pattern is universal across all vacuum systems.
Mean Free Path vs Pressure — Visual Summary
The chart below brings together the numbers from the previous sections into a single picture. As you examine it, focus on where the mean free path line crosses the horizontal reference lines for common tube diameters — those crossover points mark the approximate transition pressure for each tube size.
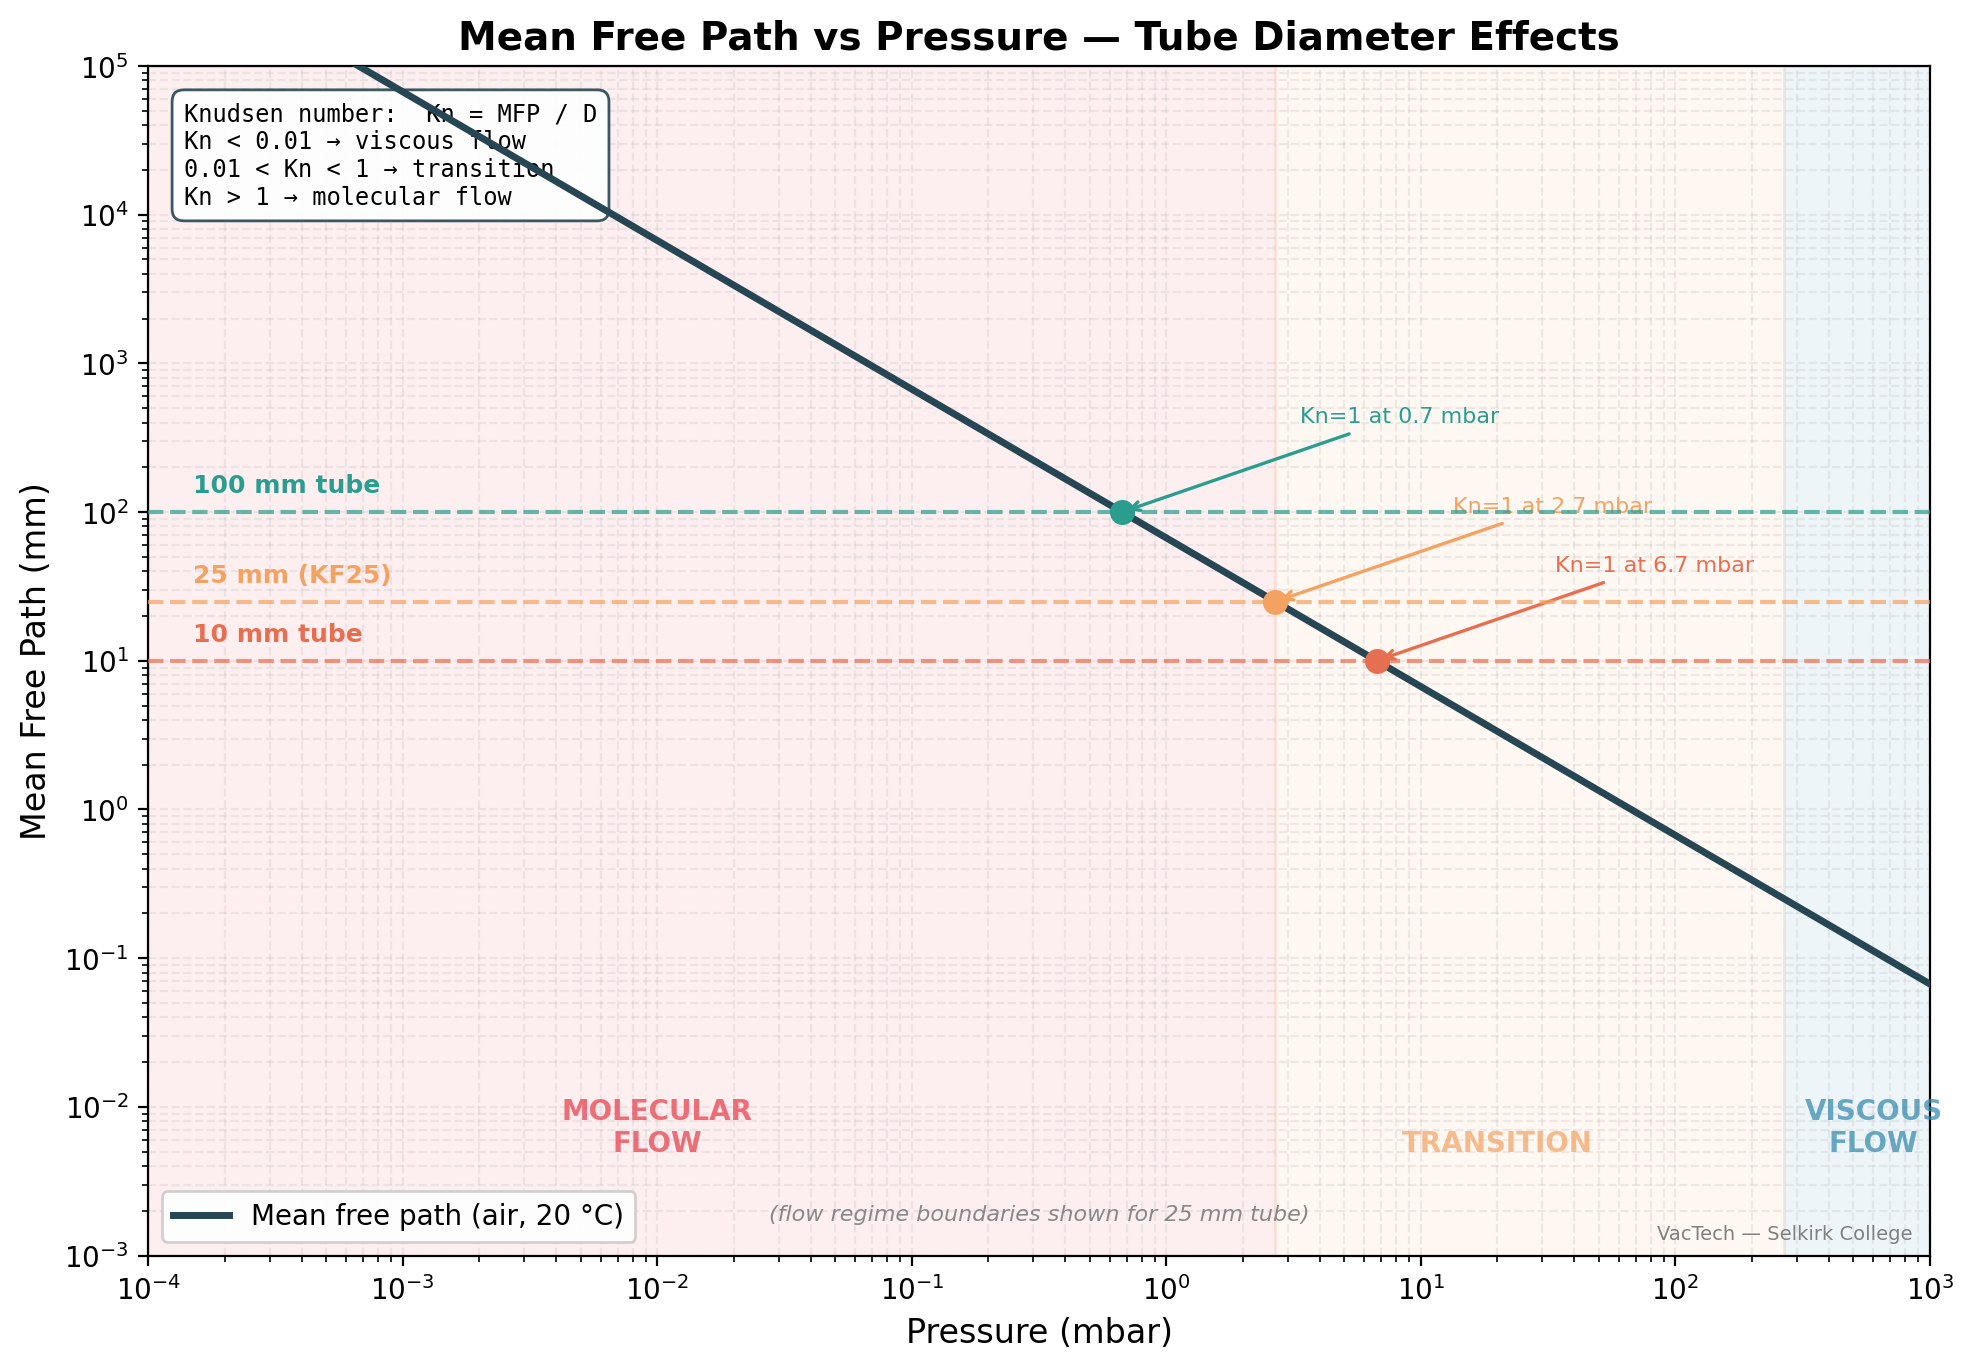
Notice that a 25 mm tube enters transition flow at a higher pressure than a 50 mm tube. This is why smaller-diameter connections become molecular-flow bottlenecks sooner during pump-down — a point that becomes central in Lesson 3 when you examine conductance.
Misconception: At low pressure in molecular flow, molecules move slowly.
Reality: Molecules at room temperature move at approximately 500 metres per second regardless of pressure. What changes is not their speed but their interaction pattern. In viscous flow, they collide with each other constantly and move collectively.
In molecular flow, they bounce off walls independently. The individual molecules are just as fast — but the net transport through a tube is much less efficient because there's no collective push.
What You Can Now Do
By the end of this section, you can:
- Explain what mean free path is and how it determines flow regime
- Describe the difference between viscous and molecular flow in practical terms
- Explain why pump-down slows at lower pressures (flow regime transition)
- Identify the three phases of a typical pump-down curve and the flow regime in each
- Explain why the pump isn't "failing" when pump-down slows
Next Steps
Now that you understand how gas behaviour changes with pressure, the next lesson focuses on what happens between the pump and the chamber — the concept of conductance, and why geometry matters more than pump size.